Battery Runtime Math: Why Nameplate Watt-Hours Are Not the Whole Story
How depth of discharge, inverter loss, idle draw, Peukert's effect, temperature, and aging turn a battery's nameplate watt-hours into a much smaller honest runtime number.
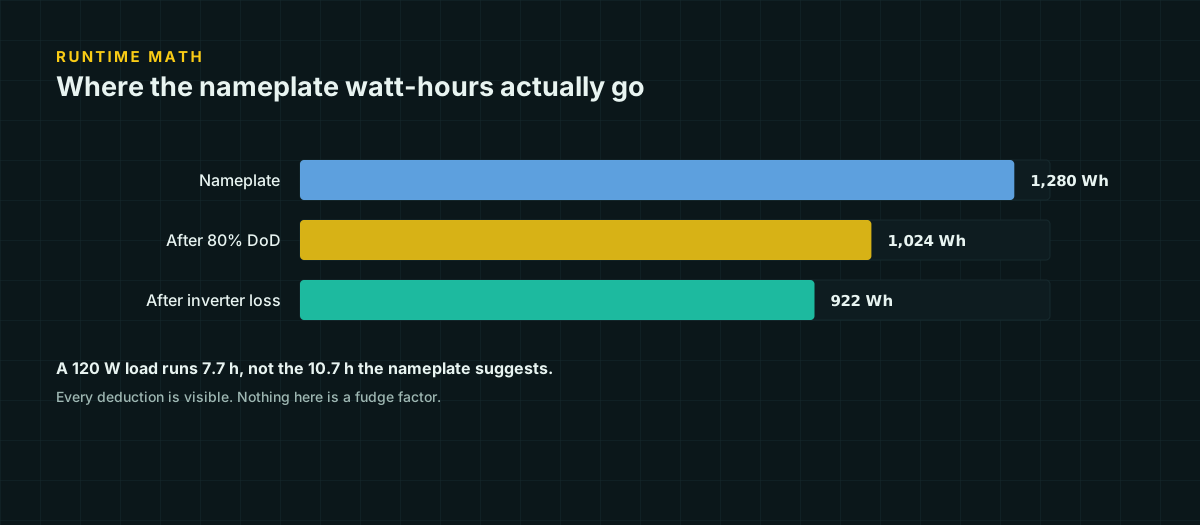
A battery labeled 1200 Wh will not deliver 1200 Wh to your load. Not because the label is lying — the nameplate figure is a real measurement, taken under a specific set of conditions — but because your system is never that battery’s specific conditions. You will use less than 100 percent of it, push current through an inverter that eats some and idles on some, pull it faster or slower than its rated discharge rate, run it warmer or colder than the test chamber, and use it after it has aged a year or five.
None of these deductions are exotic. Each one is well documented, and each one is small enough to overlook individually and large enough, stacked together, to leave a system feeling undersized for no reason its owner can identify. The rest of this page walks through the deductions one at a time, then applies all of them to one continuous battery so you can see how nameplate becomes honest runtime.
Nameplate watt-hours versus usable watt-hours
The number on a battery’s label is usually amp-hours at a nominal voltage, multiplied out to watt-hours: a 12 V 100 Ah battery is marketed as 1200 Wh. That figure describes the energy the battery can deliver from fully charged to fully discharged, at a specific, moderate discharge rate, at a specific temperature (typically 25 °C / 77 °F), when new.
Every one of those qualifiers is a place where your actual use case will differ from the test. That is not a flaw in the label — it is a standardized test result, and standardized tests have to hold everything constant except what they are measuring. The job of runtime math is to walk the number back from “under test conditions” to “under your conditions.”
Depth of discharge sets the first ceiling
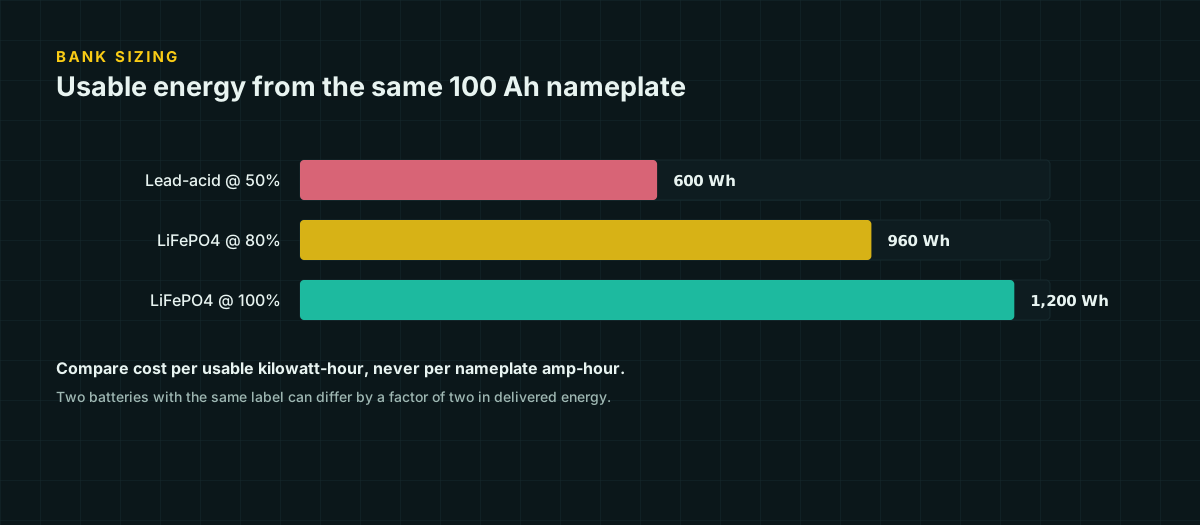
Depth of discharge (DoD) is how much of that nameplate capacity you are willing to remove before stopping. It is the largest single deduction for most chemistries, and it is a chosen limit, not a physical wall — you can pull a lead-acid battery past 50 percent DoD, you just accelerate its wear when you do.
Flooded and AGM lead-acid batteries are conventionally cycled to about 50 percent DoD; deeper regular cycling shortens cycle life sharply. LiFePO4 tolerates far deeper cycling — Battle Born rates its 100 Ah unit for 100 percent usable DoD. The full cycle-life-versus-DoD picture, with sourced numbers for LiFePO4, AGM, and gel, lives on our battery chemistry comparison page; this page assumes you already know which DoD you are planning around and focuses on what happens after that decision.
Inverter conversion loss
If your load is AC, the inverter takes a cut on every watt that passes through it. A unit that is 88 percent efficient at a given load turns 100 W of AC demand into about 114 W of DC demand on the battery:
DC watts = AC watts / efficiency
150 W / 0.88 = 170.5 W
Efficiency is not constant across an inverter’s range — most units are least efficient near their minimum and maximum load, and best somewhere in the middle third of their rating. A 150 W load on a 3000 W inverter is nowhere near that efficient middle, which is one reason the “smallest inverter that comfortably covers your loads” advice keeps coming up on this site: bigger is not free, and it is not even efficient.
Inverter idle draw — the cost of staying on
Conversion loss only happens while the inverter is doing work. Idle draw happens the entire time the inverter is switched on, whether or not anything downstream is using power — it comes from the inverter’s own control electronics and, on modified and pure sine units, the switching circuitry that stays energized waiting for a load.
This matters disproportionately for small, steady loads left running around the clock — a router, a security camera, a well pump controller. A device that only asks for 12 W of AC can become a much larger burden on the battery once idle draw is added, because idle draw does not scale down with the load; a 3000 W inverter left on to serve a 12 W load pays the same idle tax whether or not that tax is a rounding error or the dominant cost.
The practical fix is matching inverter size to actual load, and for loads that run continuously and don’t need AC, moving them to a DC-DC path that skips the inverter entirely. We build a full idle-draw calculation into the worked example below.
Peukert’s effect: lead-acid’s rate penalty
Battery capacity is not a fixed number of amp-hours — it depends on how fast you pull them out. Discharge a lead-acid battery faster than its rated rate and you get measurably fewer amp-hours than the label promises; discharge it slower and you get slightly more. This is Peukert’s effect, and it is the reason manufacturers publish capacity at multiple discharge rates (commonly C20, C10, C5, C1) rather than a single number.
The relationship is commonly expressed as:
C_effective = C_rated × (I_rated / I_actual)^(k-1)where C_rated is the amp-hour rating at the manufacturer’s test rate, I_rated is the current that produces that rate (a 100 Ah battery rated at the 20-hour, or “C20,” rate discharges at 5 A: 100 Ah ÷ 20 h), I_actual is the current you are actually drawing, and k is the Peukert exponent — a property of the specific battery.
Flooded and AGM lead-acid batteries commonly show Peukert exponents in roughly the 1.1–1.3 range in battery-engineering literature; we have not tied a single value to one manufacturer datasheet, so treat any exponent you use, including the illustrative one below, as a planning estimate rather than a specification. LiFePO4’s exponent sits much closer to 1.0. Because LiFePO4 has dramatically lower internal resistance than lead-acid, the rate-dependent capacity loss that Peukert’s equation describes is small — at the same discharge current used in the worked example below, a LiFePO4 battery loses a percent or two of rated capacity, not the 15 percent a flooded battery loses. That is one reason LiFePO4 systems tolerate higher, spikier loads without a separate rate-derating calculation.
Temperature derates capacity too
Cold reduces how much energy a battery can deliver, independent of everything above. Trojan’s published data shows roughly 50 percent of rated capacity available at -18 °C (0 °F) compared with 27 °C (80 °F) — a battery that would deliver its full nameplate figure in a heated closet can lose half its usable energy sitting in an unconditioned shed in a hard freeze.
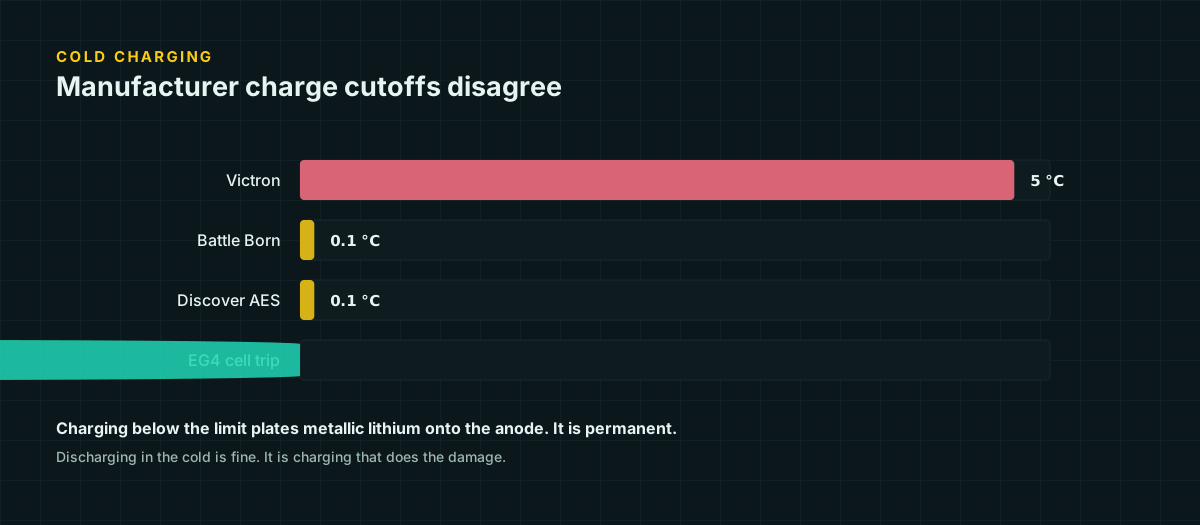
This is a capacity question, distinct from the charging question. LiFePO4 has its own cold-weather behavior, but the mechanism and the numbers are different enough — and important enough — that we cover them on their own page: Charging LiFePO4 Below Freezing and the temperature limits reference table.
Aging quietly lowers the ceiling
A battery’s nameplate capacity describes it new. Manufacturers commonly define end-of-life around 80 percent of original capacity — Battle Born’s published cycle-life figures for LiFePO4, for example, run to that threshold — which means a battery in active, unremarkable service can already be delivering meaningfully less than its label states well before anyone would call it “worn out.” A battery partway through a normal service life sitting at 90 percent of nameplate is not a fault; it is expected behavior that a runtime estimate should account for rather than be surprised by.
A full worked example, nameplate to honest runtime
Suppose a 12 V, 100 Ah flooded lead-acid battery, rated at the 20-hour (C20) discharge rate, powers a steady 150 W AC load — lighting and a laptop charger — through a 400 W inverter that is 88 percent efficient at this load and draws 6 W at idle. The battery is three years into service and testing about 10 percent below its original rating. Work through every deduction in order.
Step 0 — Nameplate energy.
12 V × 100 Ah = 1200 WhStep 1 — Depth of discharge (50%, conventional for lead-acid).
1200 Wh × 0.50 = 600 WhStep 2 — Find the actual discharge current. The inverter’s DC-side draw is the AC load divided by efficiency, plus idle draw:
150 W / 0.88 = 170.5 W
170.5 W + 6 W (idle) = 176.5 W
176.5 W / 12 V = 14.7 A
Step 3 — Apply Peukert’s effect at that current. The battery’s rated current at C20 is 100 Ah ÷ 20 h = 5 A. Using an illustrative exponent of k = 1.15 (a commonly cited mid-range value for flooded lead-acid — confirm against your own battery’s discharge-rate table if the result matters for your design):
C_effective = 600 Wh × (5 A / 14.7 A)^0.15
            = 600 Wh × 0.851
            = 510.6 Wh
Pulling this battery at nearly 3x its rated current cost about 15 percent of the DoD-limited capacity before temperature or age even enter the picture.
Step 4 — Apply temperature. In an unconditioned shed at -18 °C (0 °F), Trojan’s data indicates roughly 50 percent of rated capacity:
510.6 Wh × 0.50 = 255.3 WhStep 5 — Apply aging. At 90 percent of original rating:
255.3 Wh × 0.90 = 229.8 WhStep 6 — Convert to runtime. Divide the final usable energy by the total continuous power draw established in Step 2:
229.8 Wh / 176.5 W = 1.30 hours ≈ 1 hour 18 minutesA naive calculation — nameplate watt-hours divided by AC watts, ignoring every deduction above — would have promised 1200 Wh ÷ 150 W = 8 hours. The honest, cold-weather figure is 1.3 hours: about 84 percent less. Run the identical battery at 27 °C (80 °F) instead of -18 °C, and only Step 4 changes — the temperature factor becomes 1.0 instead of 0.50, usable energy becomes 510.6 × 0.90 = 459.5 Wh, and runtime becomes 459.5 ÷ 176.5 = 2.6 hours. Same battery, same load, same age — the only variable that moved is where the battery sits, and runtime doubled.
What this means for planning
None of the six deductions above are exotic edge cases — every off-grid system experiences depth-of-discharge limits, inverter loss, and temperature swings, and most will experience rate effects and aging too. Treat the “8-hour” nameplate number as a ceiling you will never reach in practice, not a planning figure. Build your estimate the way the worked example did: apply DoD first, work out your actual discharge current before you apply Peukert or any rate correction, apply the coldest realistic temperature for the battery’s actual location, and shave a further 10–20 percent for a battery that is not brand new. If the resulting number still covers your load with margin, the system is sized honestly. If it does not, the fix is a bigger or better-placed battery, a smaller inverter, or a genuinely smaller idle load — not a more optimistic spreadsheet.
Sources and further reading
Figures on this page are traceable to the published documents below. Where a standard is referenced, check the edition your local jurisdiction has adopted before relying on it.
- BB10012 100Ah 12V LiFePO4 deep cycle battery — specificationsBattle Born BatteriesSource for 100% usable DoD and the -20 to 60 °C discharge range for LiFePO4.
- 12.8 & 25.6 Volt Lithium Iron Phosphate Batteries Smart — datasheetVictron EnergySource for the 92% round-trip efficiency figure and 0.5C/1C charge acceptance.
- Trojan User's GuideTrojan Battery CompanySource for the ~50% capacity at -18 °C versus 27 °C figure used in the worked example.
- Does depth of discharge affect cycle life?Discover BatterySource for the conventional 50% depth-of-discharge limit on lead-acid cycling.