Solar for Cameras, Gates, and Remote Sensors: Sizing for Tiny Loads
Why very small 24/7 solar loads are harder to size than big ones: worst-month sizing, controller self-consumption, the December problem, oversizing the array over the battery, and freeze protection.
Most solar sizing guides assume the hard part is the big number — the fridge, the pump, the inverter. A camera on a gate post or a sensor on a remote fence line has the opposite problem: every load is small, which makes people assume the system is trivial to size. It isn’t. Small, constant loads expose sizing mistakes that get absorbed and hidden inside bigger systems — a controller’s own power draw, a single worst month’s sun hours, a battery too small to have any thermal or capacity margin at all.
This guide covers the sizing logic for a remote, unattended, continuously-loaded system: a security camera, a cellular or Wi-Fi uplink, and an occasional gate or sensor actuator. It assumes a small standalone off-grid installation, not one tied into a structure’s existing wiring.
Why 24/7 loads with no daily variation change the math
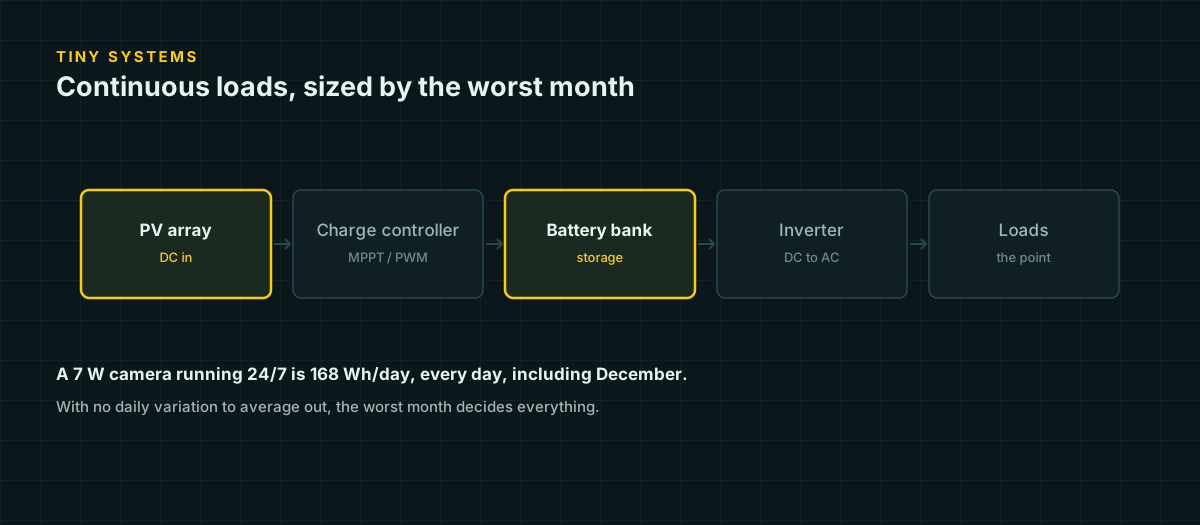
Almost every load table on this site has some variation to work with — lights that run a few hours, a laptop that charges once, a compressor that cycles. A remote camera and its network uplink typically don’t: they draw close to the same wattage at 3 a.m. as they do at 3 p.m., every day, all year. There is no “off” period to bank energy during, and no low-draw stretch to average against a high one.
That removes a design tool other systems rely on quietly: the ability for a below-average hour to be offset by an above-average one later the same day. A constant load has no such offsetting; every hour draws the same, so the daily total is just the hourly draw times 24, with none of the internal slack a variable load table has.
The worst month dominates completely
Because the load doesn’t vary through the year, the only variable left is solar production — and production varies enormously by season, especially at higher latitudes. A system sized to an annual-average peak sun hours (PSH) figure will be comfortably oversized for nine months and badly undersized for the other three, and unlike a weekend cabin, there’s nobody there to notice the shortfall building or to top off a generator.
The correct target isn’t the annual average. It’s the single worst month’s PSH for the site’s actual tilt and azimuth. We don’t publish a city-by-city PSH table on this site — NREL’s primary PVWatts data was not reachable during our research, and secondhand compilations understate what a properly tilted array sees compared to the horizontal-surface data they’re often built from. Run PVWatts with the real site coordinates, tilt, and azimuth, and read the worst month’s average daily sun hours specifically — not the annual figure at the top of the report.
The December problem at northern latitudes
The mechanism is straightforward even without a specific number attached: sun angle is lower in winter, so light travels through more atmosphere and arrives less intensely; days are shorter, so there are fewer hours for it to arrive in at all. Both effects compound in the same direction at higher latitudes, which is why a site’s worst month is very often its December or January figure, not something in between.
Snow interacts with this in two opposite ways worth understanding rather than assuming: fresh snow on the panel blocks it completely until it sheds or is cleared, but snow on the ground near a steeply tilted panel can reflect additional light onto the array once it’s clear, sometimes measurably boosting output above a snow-free reference day. Neither effect is reliable enough to design around; treat a snow-prone winter site’s worst month as the clear-sky PVWatts figure for that month, and treat any reflection boost as a bonus rather than a planning assumption.
A complete worked example
Suppose a gate camera and its cellular uplink draw a combined 7 W continuously — say 4 W for the camera and 3 W for the modem, averaged including night IR illumination — plus a gate operator motor that runs briefly a few times a day, plus the charge controller’s own idle draw.
Continuous baseline:
(4 W + 3 W) × 24 h/day = 168 Wh/dayGate operator. Suppose the motor draws 8 A at 12 V during operation, and the gate opens and closes ten times a day at about 5 seconds of run time each — 50 seconds of total daily runtime:
12 V × 8 A × (50 s / 3600 s) = 1.33 Wh/dayTrivially small in energy terms — but the motor’s peak draw is 12 V × 8 A = 96 W, a number that plays no role in the watt-hour total and every role in sizing the wire and fuse for that circuit, the same peak-versus-total distinction covered in the load audit guide.
Controller self-consumption. Small charge controllers are rarely marketed on their own power draw, and it is worth checking the datasheet specifically rather than assuming it away — on a system this size it is not negligible. Suppose this controller’s datasheet lists 0.5 W of continuous own-consumption:
0.5 W × 24 h/day = 12 Wh/dayRaw daily total:
168 + 1.33 + 12 = 181.3 Wh/dayThat controller line item alone is about 7 percent of the load table for a component that does nothing the camera or gate needed done — it exists only to manage its own charging job. On a 700 Wh/day cabin system the same 0.5 W would be a rounding error under 2 percent; on a 181 Wh/day system it’s material.
Applying a single design buffer — 25 percent here, a bit higher than a daily-use system, because an unattended site pays for undersizing with a truck roll rather than an inconvenient evening:
181.3 Wh/day × 1.25 = 226.7 Wh/day design targetBattery, sized for 2 days of autonomy at 80 percent usable DoD on a LiFePO4 bank — more autonomy than a daily-use system, again because nobody is there to intervene on day one of a bad stretch:
226.7 Wh × 2 / 0.8 = 566.7 Wh requiredA 12 V 70 Ah LiFePO4 battery is 840 Wh nominal, 672 Wh usable at 80 percent DoD — comfortable margin over the 566.7 Wh requirement, rather than sizing to the requirement exactly.
Array, using the worst-month PSH from a PVWatts run — suppose that comes back at 2.2 hours for this site’s tilt in December — and the same ~0.75 combined system-efficiency convention used elsewhere on this site (a planning figure; PVWatts’ own default combined loss factor is around 14%, secondary-sourced, and stacks with additional off-angle and cold-weather effects a small fixed mount sees):
226.7 Wh / 2.2 h / 0.75 = 137.4 W minimumOversize the array, not the battery
137.4 W is the bare floor. The better move here is not a 25-percent margin bolted onto that number the way a load estimate gets buffered — it’s a deliberate jump to the next practical panel size, because the economics of the two components run in opposite directions on a system this small.
A larger panel is a fixed, one-time cost roughly proportional to its wattage. A larger battery is not just a fixed cost — it’s also weight, physical size in an enclosure that has to survive weather and often wants to stay small and inconspicuous, and in cold climates, additional thermal mass that takes longer to reach a chargeable temperature after a cold night. Reaching the same worst-month safety margin by adding battery capacity instead of array capacity is more expensive per watt-hour of headroom gained, and it does nothing to fix the actual bottleneck, which is the worst month’s limited sun hours, not a shortage of stored energy on a clear day.
For this example, stepping up from the 137.4 W floor to a 200 W panel is a modest cost increase that meaningfully improves recovery time after a multi-day cloudy stretch and gives real margin against a worse-than-expected December. Sizing the controller for that panel:
200 W / 12 V × 1.25 = 20.8 A → next standard size, 30 A MPPT controllerWhy the cheap all-in-one units disappoint
Integrated solar security camera kits — panel, battery, camera, and controller in one enclosure — are common and frequently underwhelming in practice, and the reasons follow directly from everything above rather than being a mystery. The panel is usually sized for an assumed average PSH, not a worst-month figure, so December performance is the first thing to fail. The battery is often small enough that a controller’s own idle draw is a larger fraction of the budget than in a purpose-built system. Motion-triggered clip length and frequency are usually underestimated relative to advertised “standby days” figures, which tend to be measured with minimal triggering. And the panel angle is frequently fixed by the enclosure’s mounting bracket rather than adjustable to the site’s actual latitude, which quietly reduces winter output exactly when the worst-month problem is already tightest.
None of this means an integrated unit can’t work — it means the marketed runtime figures assume a load and a season that may not match the actual installation, and the fix is the same worked-example approach above: build the real load table, find the real worst-month PSH, and check both against what the unit actually ships with.
Freeze protection for a small battery
The same low-temperature charge mechanism that applies to any LiFePO4 bank applies here — below a manufacturer-specified cutoff, commonly between 0 °C and 5 °C, lithium plates onto the anode instead of intercalating properly during charge, which is irreversible and, in the worst case, can pierce the separator and cause an internal short. A competent BMS blocks charging below that threshold rather than allowing the damage.
A small remote battery has less thermal mass than a cabin or shed bank, so its internal temperature tracks ambient air temperature more closely and swings faster — there’s less battery to buffer a cold snap. Some remote-enclosure batteries add a small internal heater that draws power specifically to keep the cell temperature above the charge cutoff on cold mornings; that heater is itself a load worth adding to the table above if the chosen battery has one, since it can draw real power on exactly the cold, low-sun days when the array can least afford it. Weigh that against simply accepting that the battery won’t charge on the coldest mornings and will resume once ambient temperature recovers — often the simpler and more robust choice for a remote system nobody is monitoring closely.
Theft and weather exposure
A remote installation is unsupervised by definition, which changes the hardware choices in ways a monitored site doesn’t need to think about. Mounting height matters more than lock quality for a panel or battery enclosure within easy reach from the ground — raising equipment out of arm’s reach defeats casual theft more reliably than a padlock defeats a bolt cutter. Tamper-resistant fasteners slow down opportunistic removal without requiring specialized tools to install. Cable runs between panel, controller, and battery should be routed where they can’t be cut and pulled from outside the enclosure, and any exposed connector should be rated for the actual weather exposure — UV-rated jacketing, a genuinely sealed (not just weather-resistant) enclosure rating, and drip loops on any cable entry so water runs off the cable before it reaches the gland rather than wicking straight in.
Before you build
A tiny remote system rewards the same discipline as a large one and punishes shortcuts more, because nobody is on site to catch a mistake early. Build the real load table including the controller’s own draw, size to the worst month rather than the average, put the margin into the array rather than the battery, and confirm the battery’s cold-charge behavior before the first winter arrives instead of after.
Sources and further reading
Figures on this page are traceable to the published documents below. Where a standard is referenced, check the edition your local jurisdiction has adopted before relying on it.
- Understanding Temperature Limits of LiFePO4 BatteriesBattle Born Batteries, The Battle Born Educational SeriesSource for the lithium-plating mechanism behind low-temperature charge cutoffs.
- 12.8 & 25.6 Volt Lithium Iron Phosphate Batteries Smart — datasheetVictron EnergySource for the 5°C default LiFePO4 charge cutoff and 2-3%/month self-discharge range cross-referenced against Battle Born.
- PVWatts pvlib.pvsystem.pvwatts_losses documentationpvlib python, citing NREL/TP-6A20-62641 (Dobos, PVWatts Version 5 Manual)Secondary-sourced — the primary NREL PDF could not be fetched. Cited for the ~14% combined default PVWatts system loss figure referenced in the efficiency discussion.