The Load Audit: The One Step That Decides Every Other Number
How to build a real load table with watts, hours, and duty cycle, measure actual draw instead of trusting nameplate ratings, and set a design buffer without padding a solar system three times over.
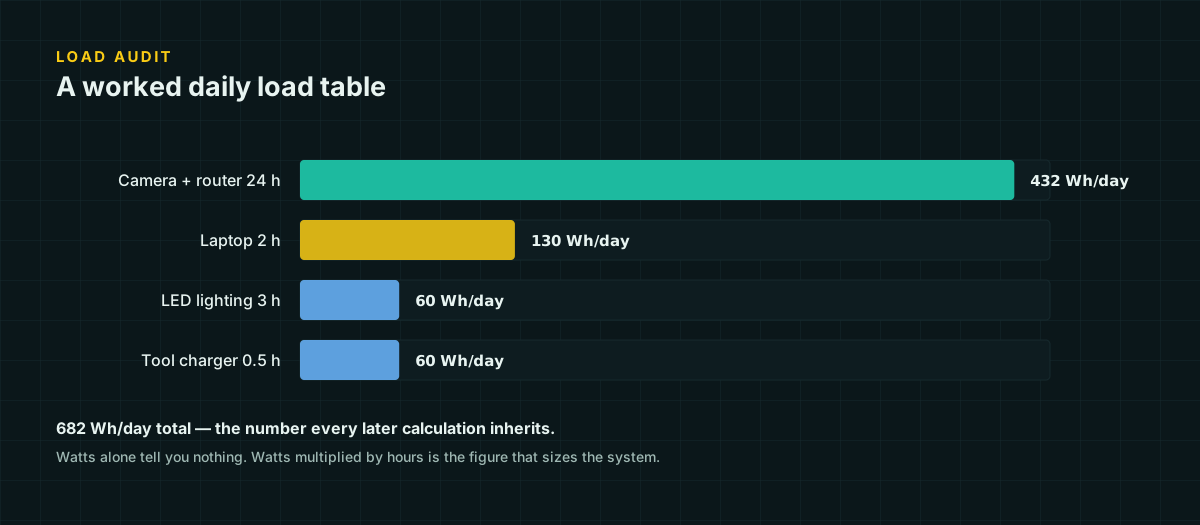
Every number that follows a solar build — battery amp-hours, array watts, controller current, wire gauge, fuse rating — is a downstream function of one input: how much energy the loads actually consume, and when. Get the load audit wrong by 30 percent and every calculation after it is wrong by roughly the same margin, except that each stage also adds its own rounding and its own safety margin, so the error does not stay at 30 percent. It compounds.
This is also the step people skip, because it is the least technical-looking part of the project. There is no wire gauge to look up, no formula with a Greek letter in it, no product to compare. It is a spreadsheet. But the spreadsheet is where a system gets sized correctly or gets sized by guesswork wearing a safety margin as a disguise.
Build the load table
A load table has four columns, and the fourth one is the point of the exercise:
Wh/day = W × hours/day × duty cycleWatts is the actual power draw, not the number printed on the box (more on that below). Hours per day is how long the device is powered on or plugged in. Duty cycle is the fraction of that powered-on time the device is actually drawing the stated wattage — 100 percent for a steady load like an LED strip, well under 100 percent for anything that cycles, like a compressor or a thermostat-controlled heater.
Duty cycle is the column beginners omit, and it is often the one that matters most. Consider a mini-fridge compressor rated 65 W. If you multiply nameplate watts by 24 hours, you get 1,560 Wh/day — wildly high, because the compressor is not running continuously. A refrigerator holding temperature in a moderate ambient might run its compressor about 35 percent of the time. Measured running draw of 60 W at a 35 percent duty cycle gives:
60 W × 24 h/day × 0.35 = 504 Wh/dayThat is the same daily energy as a steady 21 W load, even though the compressor’s nameplate rating is three times that. Duty cycle is what makes a cycling load comparable to a continuous one.
A complete worked load table
Suppose a small structure runs LED shop lights, a router and camera that stay on continuously, occasional laptop charging, a cordless tool charger, a mini-fridge, and a motion-triggered security floodlight.
| Device | Measured watts | Hours/day | Duty cycle | Wh/day |
|---|---|---|---|---|
| LED shop lights | 36 W | 4 h | 100% | 144 |
| Router + IP camera | 15 W | 24 h | 100% | 360 |
| Laptop charging | 45 W | 2 h | 100% | 90 |
| Cordless tool charger | 55 W | 1 h | 100% | 55 |
| Mini-fridge compressor | 60 W | 24 h | 35% | 504 |
| Motion floodlight | 20 W | 0.33 h | 100% | 6.7 |
| Total | ≈ 1,160 Wh/day |
Notice that the largest single contributor is not the load with the highest wattage. The tool charger draws more instantaneous power than the router, but the router runs 24 times longer, and the fridge — the smallest nameplate rating on the sheet at 60 W — is the single biggest line item because it never really stops. Total energy, not peak power, is what sets battery and array size.
Nameplate watts is a ceiling, not a draw
The number printed on a device, its packaging, or its power brick is almost always a maximum rating, a UL/CSA safety ceiling, or a marketing figure — not a measurement of what it actually pulls under real conditions.
A laptop charger stamped “65 W” only draws close to 65 W while the battery is empty and charging at full rate. Once the battery nears full charge, the draw tapers, often to a fraction of the nameplate figure, and it stays there for as long as the laptop remains plugged in. A router listed at 18 W by its power supply’s rating commonly draws 8–12 W in practice; the power brick is sized for worst-case conditions the router rarely reaches. Motors are the opposite problem: running watts are frequently much lower than the locked-rotor or starting current implies, but the brief starting surge is real and matters for a different reason — see the peak-versus-total discussion below.
Sizing a battery and array from nameplate ratings without measuring anything real tends to overbuild the daily-energy side of the system substantially, while simultaneously underbuilding for the brief current spikes nameplate ratings don’t describe at all. It is possible to get both wrong in opposite directions from the same bad assumption.
Phantom and standby loads
Anything left plugged in draws something, even when it looks “off.” A wall-wart charger with nothing connected, a TV in standby waiting for a remote signal, a router’s status LEDs, a charge controller’s own display and logic circuit — these are all phantom loads, and individually they look too small to matter.
They do not stay small. A 2 W phantom draw sitting there for 24 hours a day is 48 Wh/day, indistinguishable in the table above from the tool charger’s real, intentional 55 Wh/day. On a system this size, three or four forgotten phantom loads can add up to a meaningful fraction of the daily budget, and unlike the loads you planned for, nobody remembers to turn them off because nobody thought of them as “on” to begin with.
The fix is not clever engineering. It is walking the structure with everything you own plugged in and writing down anything with a light on it, a clock display, or a transformer that feels warm to the touch. If a device has a hard power switch that fully disconnects it, note that too — it is the cheapest possible load reduction available.
Intermittent vs continuous: why peak needs its own number
Total daily watt-hours answers “how big does the battery and array need to be.” It does not answer “how much current might flow at once,” and that second question is a separate calculation with its own consequences: inverter continuous rating, conductor ampacity, and fuse sizing all depend on it.
Go back to the worked table. The devices do not all run at once in the ordinary case, but nothing stops them from doing so. If the tool charger, laptop charger, lights, router, floodlight, and fridge compressor all happen to be active in the same minute:
36 + 15 + 45 + 55 + 60 + 20 = 231 W simultaneousThat 231 W figure never shows up in the 1,160 Wh/day total, because total energy doesn’t care when the watts were consumed — only that they were. But it is exactly the number an inverter’s continuous power rating and a distribution conductor’s ampacity need to be checked against. A system sized only from the daily total can have a comfortably large battery and still trip an undersized inverter the first time three loads land on the same minute.
Write down both numbers from the load table: the sum of the Wh/day column for energy sizing, and the sum of watts across everything that could plausibly run together for power sizing. They are not the same question, and a load audit that only answers one of them is half finished.
Seasonal load variation
A load table built in July is not the same load table that applies in January, and not just because of heating or cooling. Daylight hours change what “on” time looks like — lights that ran three hours a day in summer might run six in winter. A router’s enclosure temperature swings, and switching power supplies draw slightly more at temperature extremes. A security camera’s infrared illuminators for night vision draw meaningfully more power than the daytime sensor alone, so a device with a flat nameplate rating can have a real seasonal duty cycle baked into it — more dark hours means more time in the higher-draw IR mode.
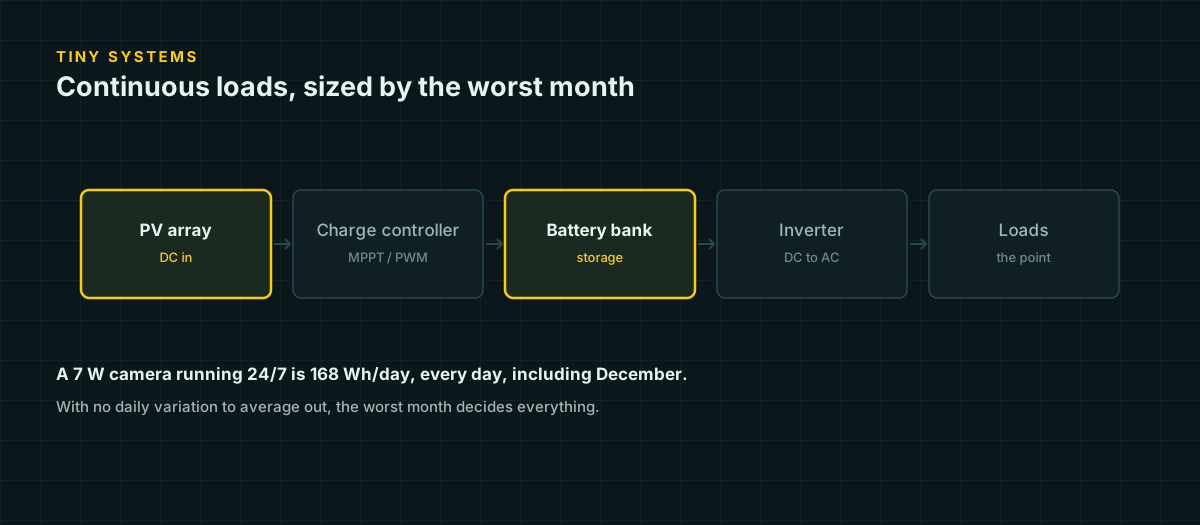
The practical answer is not to build four seasonal load tables. It is to build the table around the worst realistic month for that specific load category — winter for lighting and IR-heavy cameras, summer for anything with a cooling fan working harder — rather than an annual average that undersizes the season that actually matters. A system that comfortably covers its hardest month covers every easier one automatically; the reverse is not true.
Measuring real draw: clamp meter or inline watt meter
Two inexpensive tools turn “the label says” into “the meter says.”
An inline watt meter — the AC-outlet “Kill-A-Watt” style device, or a USB power meter for small electronics — sits between the device and its power source and reads watts, and usually cumulative watt-hours, directly. This is the easiest and most direct measurement for anything with a standard plug, and it captures duty-cycle behavior automatically if you let it run long enough to see a full on/off cycle on something like a fridge or a thermostat-controlled load.
A clamp meter reads current by measuring the magnetic field around a single conductor, without breaking the circuit — clip it around one wire (not both conductors of a cable together, which cancels the reading to zero) and read amps directly. Multiply by voltage for watts. This is the more useful tool on the DC side of a solar system, where inline AC watt meters don’t apply: clamp a DC-capable meter around the battery-to-load cable and you get real draw, real duty cycle, and real peak current on the actual circuit you are about to design around.
Either tool converts assumption into measurement. A day or two of logging on the loads that dominate the table — usually the always-on ones — is worth more than an afternoon spent debating nameplate ratings on a forum.
The buffer question: pad once, not three times
Every stage of a load audit invites a little padding. Round the nameplate rating up “to be safe.” Round the hours-per-day estimate up because you might use it more than planned. Then apply a standard design buffer — commonly 20–25 percent — at the end, for cold weather, cloudy-day margin, and the near-certainty that one more device gets added later.
Any one of those is reasonable. All three, stacked, are not, because the padding compounds multiplicatively, not additively. Three independent 20 percent margins do not add up to a 20 percent buffer:
1.20 × 1.20 × 1.20 = 1.728That is a 73 percent oversize dressed up as a 20 percent one, and it does not stop at the load table — it propagates through battery amp-hours, array watts, controller current, and wire gauge, each of which may add its own conventional margin on top. The system that results is not “extra safe.” It is expensive in ways that buy little real reliability, and an oversized array or battery does not fix a load estimate that was wrong for the wrong reasons in the first place.
The better discipline: measure real draw wherever practical, so the watts column is already honest rather than pre-padded. Then apply exactly one design buffer, once, at the end of the table, and name what it is for. In the worked example above:
1,160 Wh/day (measured) × 1.20 = 1,392 Wh/day (design target)One buffer, one stated reason — cold-weather losses, cloudy-day margin, and the practical certainty that a system this size acquires one more device within a year. If a specific additional risk applies to your build — a well pump that might run longer during a dry spell, a heater that might see an unusually cold snap — name that risk and size for it deliberately, rather than reaching for a second generic multiplier on top of the first.
Where this table goes next
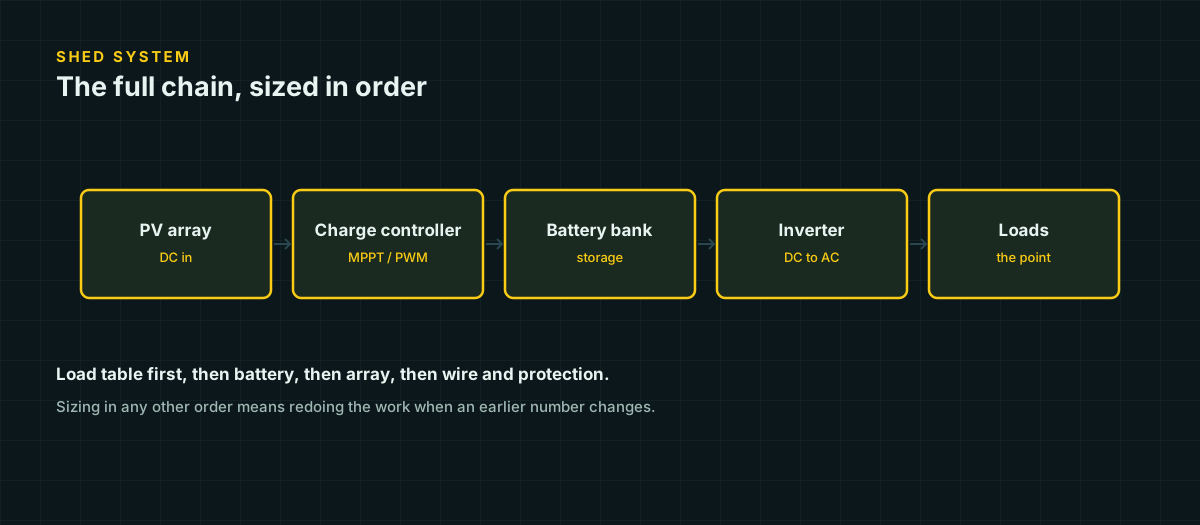
The Wh/day design target and the simultaneous-watts peak are the two numbers every other page on this site asks you to bring with you. Battery sizing multiplies the daily figure by days of autonomy and divides by usable depth of discharge. Array sizing divides the daily figure by peak sun hours and system losses. Inverter sizing checks against the peak-watts figure, not the daily total. Wire and fuse sizing depend on the actual current each circuit will carry, which is a function of both.
Do the load audit first, and do it with measured numbers where you can get them. Everything downstream is arithmetic on an input; if the input is fiction, precise arithmetic on it is still fiction, just more confidently presented.