Your Solar System Underperforms: A Diagnostic Order of Operations
A measurement-based decision tree for diagnosing four common solar complaints, with the ordered tests that isolate voltage drop, panel faults, mismatch, and charge-acceptance limits.
Most solar troubleshooting guides list possible causes in no particular order and let the reader guess which one applies. That works poorly, because half the causes on any such list produce the same symptom. “Battery never charges fully” can mean an undersized array, a controller current limit, voltage drop eating your harvest, or a charge profile set wrong — and staring at the symptom will not tell you which.
What separates the causes is measurement, taken at specific points, in a specific order, because each measurement rules something in or out before you move to the next one. This page is organized by symptom, and each symptom section gives the ordered tests that discriminate between its likely causes.
The three measurement points, and what comparing them tells you
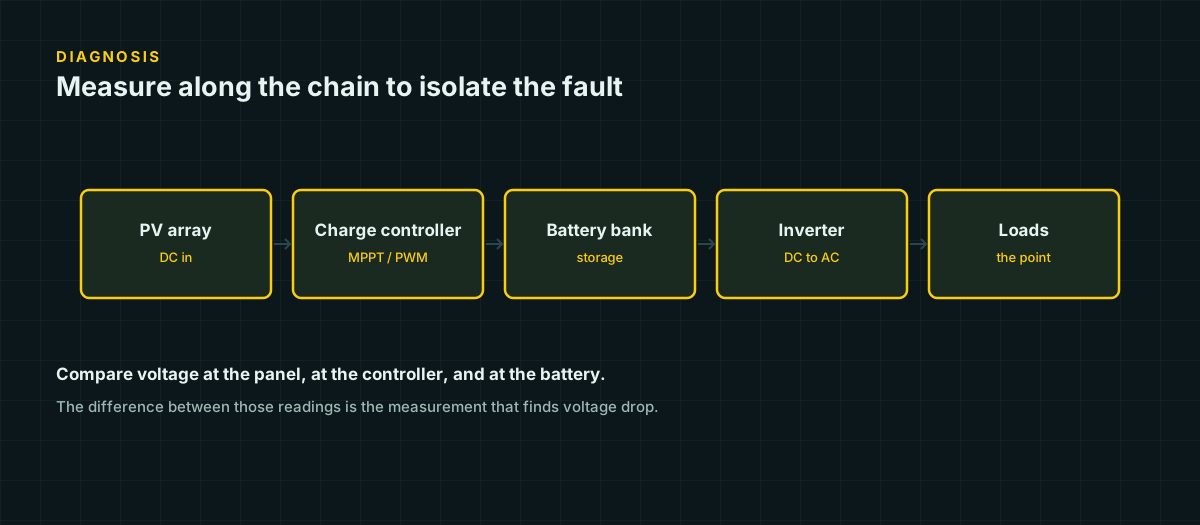
Before the symptom-specific sections, one method applies to nearly everything below: measuring voltage at the panel, at the controller, and at the battery, then comparing the three.
- At the panel or array combiner tells you what the source is actually producing right now, independent of anything downstream.
- At the charge controller input and output tells you what actually reached the controller, and what the controller is choosing to deliver to the battery.
- At the battery terminals tells you what the battery actually receives, which is the only number that determines whether it charges properly.
A meaningful gap between panel and controller isolates the array-to-controller wiring as the problem. A meaningful gap between controller and battery isolates the controller-to-battery wiring. No gap anywhere, but the battery still underperforms, points away from wiring entirely and toward the controller’s programming, the array’s actual capacity, or the battery itself. This three-point comparison is the backbone of nearly every diagnosis below — read it once and you will recognize it reappearing in each symptom section.
Symptom: battery never reaches absorption
The controller stays in bulk-charge mode, current keeps flowing, but voltage never climbs to the absorption setpoint, or takes far longer than it should.
| Likely cause | Probability | Confirming measurement | What it rules in / out |
|---|---|---|---|
| Array undersized for the bank | High | Compare measured array wattage at peak sun to the battery’s rated charge-acceptance current (see table below) | If array watts ÷ battery voltage is below the battery’s continuous charge-current rating, the array is the ceiling, not a fault |
| Voltage drop between controller and battery | High | Measure voltage at controller output and at battery terminals simultaneously, under full charge current | A gap of more than a few tenths of a volt at 12 V means the controller thinks the battery is fuller than it is, and backs off early |
| Wrong battery-chemistry profile | Medium | Check controller’s absorption voltage setting against the battery datasheet | Absorption set too low for the chemistry means the controller stops “charging” before the battery is actually full |
| Controller current-limited by its own rating | Low–Medium | Compare controller’s rated max output current to the current it is actually delivering during full sun | If the controller is already delivering its full rated current, the array may be capable of more than the controller can pass |
Charge acceptance is the number most people skip checking, and it decides whether the array-versus-controller question even matters. A 100 Ah battery accepts current at a rate set by its chemistry:
| Chemistry | Recommended charge rate | 100 Ah battery accepts |
|---|---|---|
| LiFePO4 | 0.5C continuous, 1.0C max | 50 A, up to 100 A |
| AGM | 0.2C standard | 20 A |
| Gel | 0.2C maximum | 20 A |
If a flooded or AGM bank is capped near 20 A of charge acceptance, a 400 W array producing 30 A at 12 V is not the bottleneck — the battery physically cannot absorb more than it is rated for regardless of array size. In that case “battery never reaches absorption quickly” may not be a fault at all; it may be the chemistry behaving as designed. This is the first thing to rule out, because it changes what you even go looking for next.
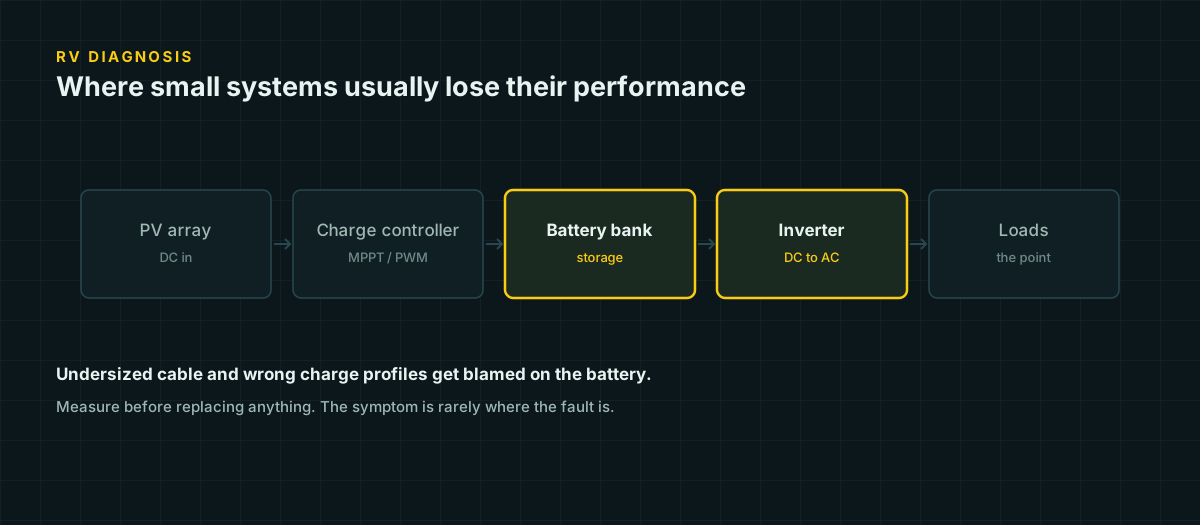
If charge acceptance is not the limit, move to the controller-to-battery voltage comparison. A controller that measures 14.4 V at its own output terminals while the battery reads 13.9 V is losing half a volt somewhere in between — undersized cable, a loose lug, or a fuse holder with degraded contact resistance. That voltage never makes it to the battery, so the controller’s internal logic, which regulates based on what it believes the battery is receiving, ends the charge cycle believing the job is done.
Symptom: harvest far below expectation
The system produces noticeably less energy per day than a rough calculation predicted, even accounting for weather.
Step one: compare measured Voc against datasheet, temperature-corrected. Open-circuit voltage is the fastest single test for a panel fault, because it requires no load and isolates the panel from everything downstream. Measure Voc directly at the panel leads, then correct the datasheet Voc for actual cell temperature:
Voc(cold) = Voc(STC) × [1 + (Tcell − 25°C) × (tempco_Voc / 100)]A measured Voc significantly below the corrected expected value — more than a few percent — points to a panel fault: a damaged cell string, a failed bypass diode, or a degraded connector. A measured Voc that matches expectation closely means the panel itself is healthy, and the loss is happening elsewhere: shading, mismatch, wiring, or the controller’s tracking.
Step two: clamp meter on each parallel string. If strings are wired in parallel, clamp each one individually under identical sun and compare. Strings should read within a small percentage of each other. A string reading well below its neighbors under the same sun isolates that specific string — shading on part of the array, a failing module within that string, or a wiring fault unique to that run — rather than an array-wide problem.
Step three: check for partial shading nobody accounted for. A single shaded cell in a series string can drag down the output of the entire string, not just its own fractional share, because of how series strings share current. Walk the array at the time of day when harvest is lowest relative to expectation and look for shadows — a vent pipe, an antenna, a tree that has grown since installation — that were not present, or not considered, when the system was designed.
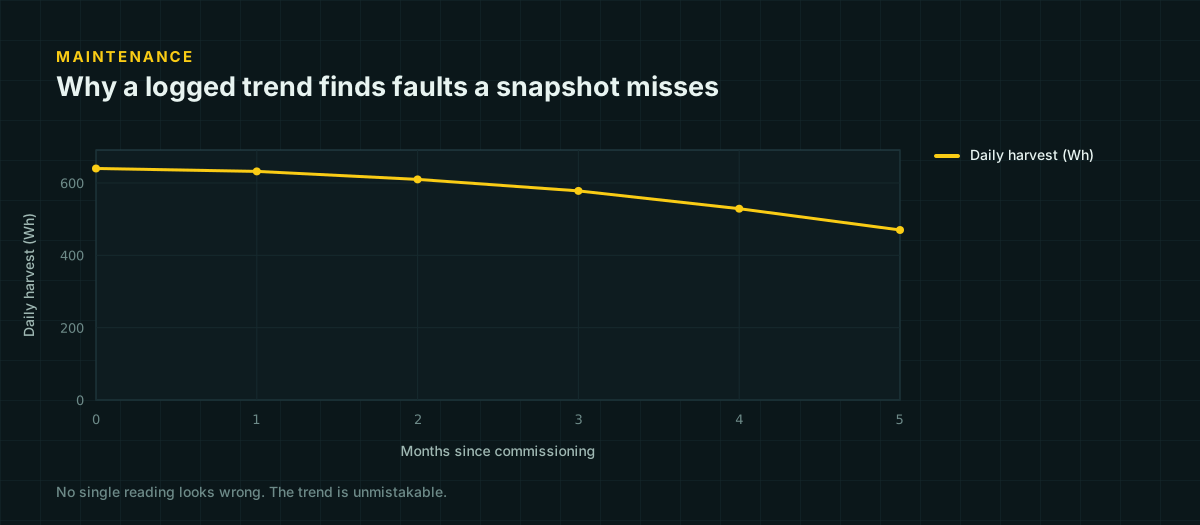
Step four: revisit the loss assumptions in your original estimate. If Voc checks out, strings match each other, and there is no shading, the gap may be between the estimate and reality rather than a fault. Real systems lose output to soiling, wiring resistance, connection losses, and inverter or controller conversion inefficiency — commonly-cited industry loss modeling puts the combined effect in the range of roughly 14 percent under PVWatts’ default assumptions, though that figure is a widely used default rather than a site-specific measurement. If your original planning number did not account for cumulative losses of that scale, the “underperformance” may be the plan being optimistic, not the system being faulty.
Symptom: inverter cutting out under load
The inverter powers on, runs briefly or intermittently under load, and shuts down — often with a low-voltage or overcurrent fault code.
The discriminating measurement here is voltage at the battery terminals at the moment the load is applied, not at rest. A battery can read a healthy resting voltage and still sag hard the instant a real load — especially a motor, compressor, or the inverter’s own surge current — draws current through it.
- Measure resting battery voltage first, load disconnected, to establish a baseline.
- Measure again with the load running, at the battery terminals directly, not at the inverter’s DC input. A large gap between the two readings under a load the battery should handle easily points to internal battery resistance — aging cells, a battery too small for the load, or (in a parallel bank) a bad connection between banks — rather than a wiring problem.
- Measure at the inverter’s DC input terminals under the same load. If this reading is meaningfully lower than the simultaneous battery-terminal reading, the drop is happening in the cable between battery and inverter — undersized conductor, a loose lug, or a run longer than the design accounted for.
- Check the fuse or breaker between battery and inverter for resistance under load — a fuse holder with degraded spring tension or corroded contacts can add resistance that only shows up as a voltage drop across the fuse itself while current is flowing, and reads perfectly fine with a simple continuity check at rest.
This ordered sequence — battery at rest, battery under load, inverter input under load, then the fuse — walks the fault from the source outward, and each step narrows where the drop is actually occurring.
Symptom: battery dies overnight
The battery shows a reasonable state of charge at sunset and reads badly depleted by morning, with no obvious loads running.
This symptom almost always means parasitic draw, not a bad battery, and the confirming measurement is direct: clamp an ammeter on the main battery cable with every known load switched off and read what current is still flowing. Anything more than a few tens of milliamps deserves investigation — that is well above what a battery’s own self-discharge should account for over a single night for any of the common chemistries.
Common sources, roughly in order of how often they turn out to be the culprit:
- Inverter left on. Even idle, an inverter draws standby current continuously; this is frequently the single largest parasitic load in a small system, and it is invisible if the inverter’s on/off switch is easy to forget about.
- A charge controller’s own night-time consumption, which is normal and usually small, but worth confirming against the datasheet if the draw seems disproportionate.
- A device that appears “off” but is actually in standby — many DC accessories, USB chargers, and monitoring displays draw a trickle continuously rather than truly powering down.
- A fault current path — a chafed wire touching a grounded chassis or enclosure, which is a wiring problem, not a load problem, and is worth ruling out if the draw is larger than any plausible device could produce.
Isolate by disconnecting loads one at a time while watching the clamp meter, rather than guessing. The load responsible for the draw will be the one whose disconnection makes the current reading drop.
Reading the results together
None of these tests are diagnostic in isolation the way they are in sequence. A single voltage reading tells you a number; three voltage readings taken at the panel, the controller, and the battery, compared to each other, tell you where the system stopped doing what it was designed to do. Build the habit of measuring at boundaries — every point where one component’s output becomes another component’s input — and most underperformance complaints stop being mysteries and start being arithmetic.
Sources and further reading
Figures on this page are traceable to the published documents below. Where a standard is referenced, check the edition your local jurisdiction has adopted before relying on it.
- 12.8 & 25.6 Volt Lithium Iron Phosphate Batteries Smart — datasheetVictron EnergySource for LiFePO4 charge acceptance (0.5C continuous, 1C max) used in the absorption-related diagnostic table.
- Gel and AGM Batteries — datasheetVictron EnergySource for AGM and gel charge acceptance figures (0.2C standard) and absorption voltage differences.
- Matching Victron Energy solar modules to the new MPPT charge regulatorsVictron EnergySource for the Voc temperature coefficient formula used to correct measured Voc for cell temperature before comparing to datasheet.
- NEC Chapter 9, Table 8 — Conductor Properties (DC resistance, uncoated copper)NFPA 70, republished by buildmyowncabin.comUsed for the voltage-drop worked example.
- pvlib.pvsystem.pvwatts_lossespvlib python documentation, citing A. P. Dobos, PVWatts Version 5 Manual, NREL/TP-6A20-62641, 2014Secondary-sourced: the primary NREL PDF could not be fetched directly. Combined default PVWatts loss factors total approximately 14 percent, used here only as a general planning reference, not a site-specific measurement.