Voltage Drop in Low-Voltage Solar Wiring: A Plain-English Guide
What voltage drop physically is, why it dominates 12 V and 24 V design, how to measure it with a multimeter, and the three levers that actually fix it.
Voltage drop is the voltage a circuit loses to the resistance of its own wire before it reaches the load. Every conductor has some resistance, current flowing through resistance produces a voltage loss, and that loss subtracts directly from what the load actually sees — the load never finds out the source was really putting out 12.6 V, it only experiences whatever arrived after the wire took its cut.
At 120 V household voltage that cut is usually trivial. At 12 V it often is not. This guide covers the mechanism, why low-voltage DC systems are unusually exposed to it, how to catch it with a multimeter on a running system, and what actually fixes it once you’ve found it.
What voltage drop physically is
Copper is a good conductor, not a perfect one. A real length of wire has a real resistance, measured in ohms, and Ohm’s law says voltage lost equals current times resistance. Run current through any length of wire and some voltage is consumed just pushing electrons through the copper — before any of it reaches the load.
This is not a defect or a sign of bad wire. It is what wire does. The question a designer answers is not “does my wire drop voltage” — it does, always — but “does it drop an amount small enough not to matter for this circuit.”
One detail that catches people who calculate a number once and trust it forever: resistance itself rises with conductor temperature. The copper resistance figures used throughout this site, and in most published tables, are referenced at 75 °C. A cable run through a hot attic, a sealed battery box in direct sun, or simply carrying current near its rated ampacity will run hotter than that reference point and will therefore drop more voltage than the room-temperature arithmetic predicts. It is one reason a real measurement, covered further down, is worth taking even after you’ve done the calculation.
Why it dominates low-voltage DC design
The loss is in volts, but what matters to a device is the loss as a percentage of the voltage it expects. The same 0.5 V loss is 0.4% of 120 V and irrelevant. At 12 V it is 4.2% and potentially the difference between an inverter that runs and one that doesn’t.
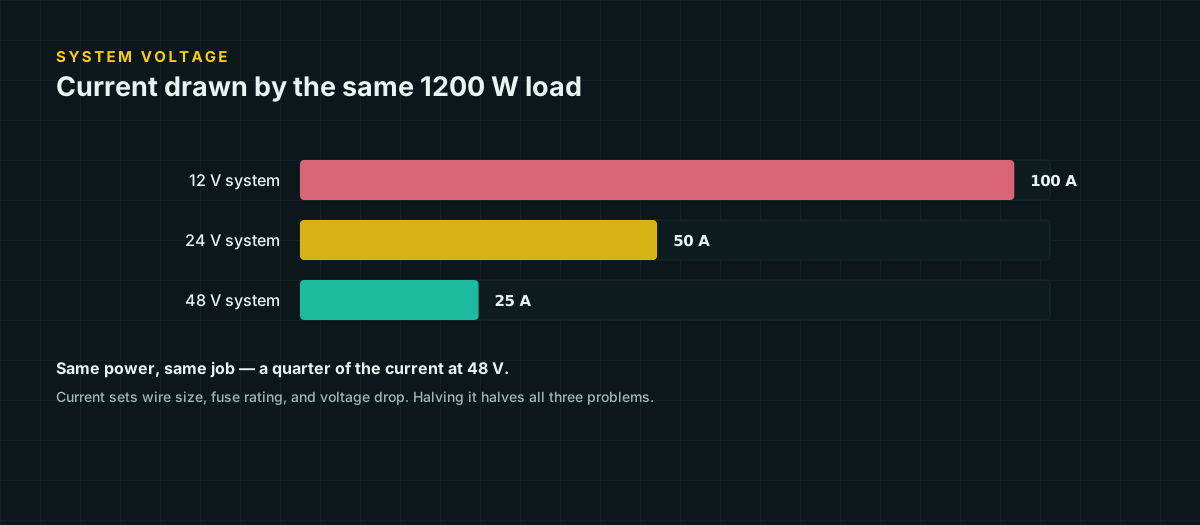
Low-voltage DC systems also tend to run more current for the same power, which multiplies the problem. A 600 W load draws 5 A at 120 V, 50 A at 12 V. Voltage drop scales with current, so the same wire and the same run length produces ten times the volt-loss at 12 V that it would at 120 V — on top of the fact that each lost volt already counts for more, percentage-wise, at 12 V. Both effects point the same direction, and both get worse the lower the system voltage goes. See 12 V vs 24 V systems for exactly how much of a difference that makes, worked through with real numbers.
The round-trip length people get wrong
Current does not disappear at the load. It flows out through one conductor and back through the other to complete the circuit. Both directions have resistance, so the length that matters to the drop calculation is twice the one-way distance to the load:
V_drop = 2 × L × I × RL here is the one-way distance. The factor of 2 accounts for the return path. A battery 15 feet from a load has a 30-foot electrical circuit, not a 15-foot one, and skipping the factor of 2 is the single most common arithmetic mistake in DIY drop calculations — it silently halves your answer and makes an undersized wire look fine on paper.
Ampacity limits versus drop limits: two different questions
It is easy to check a wire against an ampacity table, see a comfortable margin, and conclude the wire is fine. Ampacity answers “will the insulation survive the heat.” It says nothing about whether the load at the far end is getting a usable voltage.
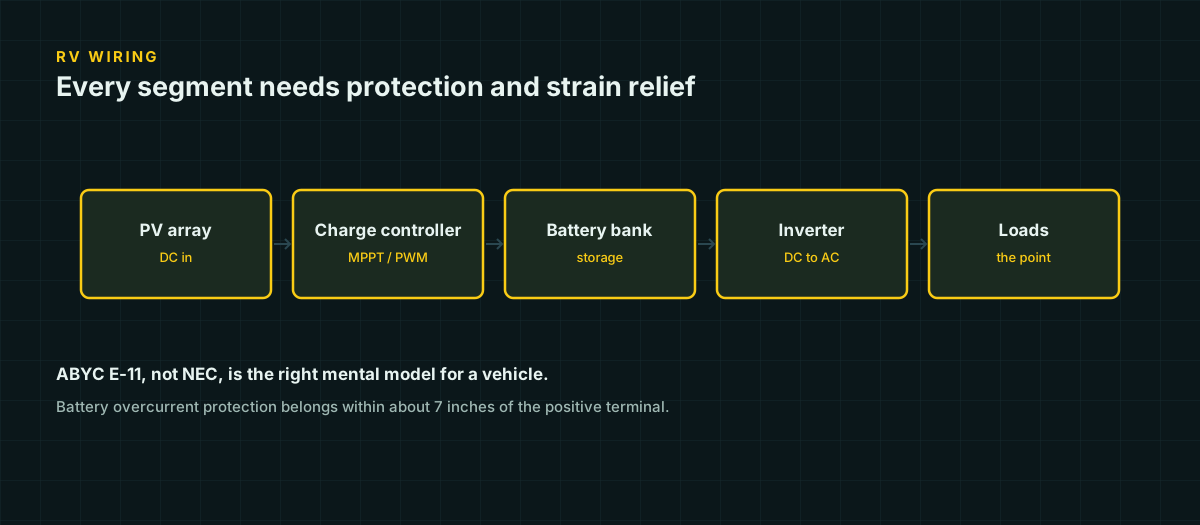
These are genuinely separate limits, set for separate reasons, and in low-voltage DC design the drop limit is very often the tighter one. The DC wire ampacity reference covers the safety side in full, including the NEC-versus-ABYC question and the temperature and bundling derates that apply before you can trust a table number. This article is about the other limit — the one that decides whether the system actually works, not just whether it’s safe.
Symptoms of excessive drop in a real system
Excess drop rarely announces itself as a wiring problem. It shows up as something else looking broken:
| Symptom | What’s actually happening |
|---|---|
| Inverter trips on low-voltage cutoff under load, but the battery reads fine at rest | The inverter’s input terminals, not the battery, are what the cutoff monitors — and drop between them can be large enough to trigger it while the battery itself is nowhere near empty |
| Charge controller display never reaches absorption voltage | The controller regulates the voltage at its own output terminals. If there’s meaningful drop between the controller and the battery, the battery genuinely never reaches absorption even though the controller thinks it delivered it |
| Lights dim or a fridge briefly browns out when a pump or compressor starts | A shared branch circuit sags under the starting surge of another load on the same run |
| A “good” battery reads low only while something is running | The voltage sag is in the wire between the meter’s measurement point and the battery, not in the battery itself — a common false diagnosis that leads people to replace a healthy battery |
The common thread: drop hides behind whatever component happens to be watching the voltage at the moment it collapses. The component gets blamed. The wire is the actual cause.
None of this means every warm cable or every dip on a battery monitor is a wiring emergency. A cable that is merely warm to the touch under sustained full load is often just carrying current normally — heat is a function of ampacity, not drop, and the two can point in different directions. The distinguishing question is always the same: measure the voltage at both ends of the suspect run, under the load that’s causing the symptom, and let the number answer it instead of guessing from a symptom alone.
How to measure drop with a multimeter on an energized system
Calculation predicts drop from wire tables. Measurement tells you what’s actually happening in the wire you actually installed, including terminations the formula doesn’t know about.
- Set the meter to DC volts and measure at the battery terminals with the suspect load switched off. This is your reference — call it the resting voltage.
- Turn the load on and let it settle for a few seconds. Measure again at the battery terminals. Any drop here is inside the battery itself (internal resistance) plus anything between the meter probes and the actual cell terminals, not the run you’re testing.
- Move the probes to the load’s input terminals — the back of the inverter, the input lugs on a DC-DC charger, wherever the circuit under test actually ends — with the load still running. Measure again.
- Subtract. The difference between the battery-terminal reading and the load-terminal reading, both taken under load, is the drop across the wire run between them.
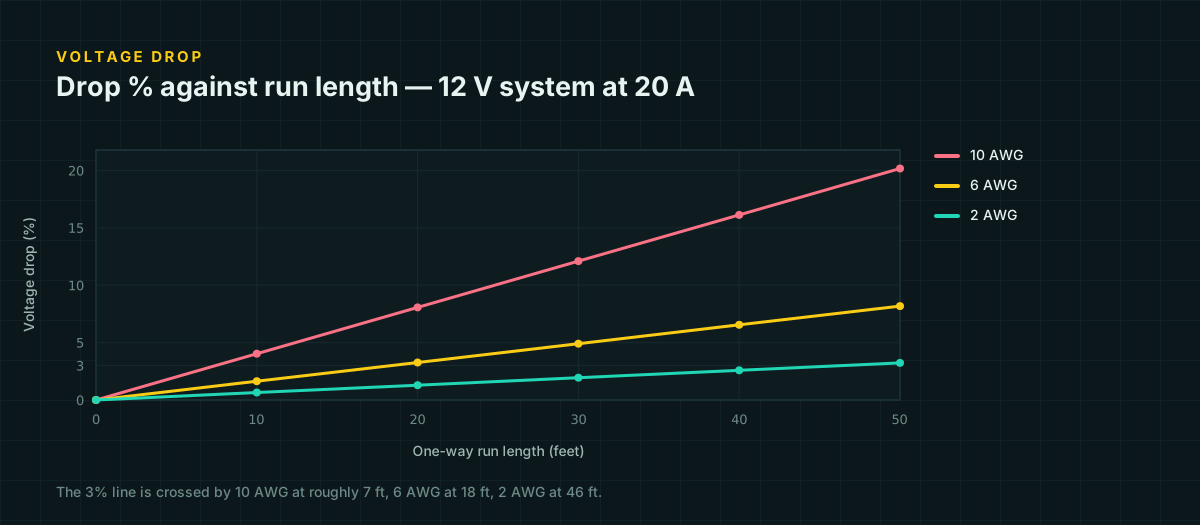
Compare that measured number to what the formula predicts for the wire you installed. Suppose a 12 V system feeds a 20 A load through 12 feet (one-way) of 10 AWG copper, at 0.00121 Ω/ft:
V_drop = 2 × 12 × 20 × 0.00121 = 0.58 V
drop % = 0.58 / 12 × 100 = 4.8%
If the multimeter shows something close to 0.58 V, the wire is behaving exactly as the copper resistance predicts, and 4.8% is your baseline to decide whether it’s acceptable for this circuit. If the meter instead shows something closer to 1.2 V or more, the wire itself isn’t the culprit — connection resistance is. A loose lug, a corroded terminal, or an underrated crimp adds resistance the formula has no way to account for, because the formula only knows about the copper. Excess measured drop beyond the calculated prediction is one of the more reliable ways to catch a bad termination before it gets hot enough to matter.
Three levers to reduce it, ranked by effectiveness
Raise the system voltage. This is the biggest lever by far, because drop percentage scales with the square of system voltage for the same delivered power — doubling voltage roughly quarters the drop percentage, not just halves it. It is also the most disruptive change, since it usually means a different charge controller, inverter, and battery configuration, not just different wire.
Shorten the run. Drop is directly proportional to length. Moving an inverter three feet closer to the battery, or relocating a distribution panel to the middle of a building instead of one end, is often free and cuts drop proportionally. This is the lever worth checking before buying anything.
Increase the wire size. Always works, but with diminishing returns: three gauge sizes up roughly halves resistance and therefore drop, but cable gets harder to bend, harder to terminate, and meaningfully more expensive per foot as it grows. It is the lever you reach for once shortening the run and reconsidering the voltage are both off the table.
A fourth option — reducing the current itself, by choosing a lower-draw device or running it on native DC instead of through an inverter — is worth a mention even though it isn’t strictly a wiring lever. Sometimes the cheapest fix to a drop problem is not carrying as many amps in the first place.
Where to go for the numbers
This article covers the mechanism. For the actual maximum run lengths by wire size, current, and voltage — the lookup tables that tell you exactly how many feet 10 AWG is good for at 20 A and 3% drop — see the voltage drop reference tables. They cover 12 V, 24 V, and 48 V at both the 3% and 10% drop limits, with the same formula used above applied across the full range of wire sizes.
Design with margin rather than to the exact limit. The tables assume clean 75 °C copper resistance with no allowance for connection resistance, and as the multimeter check above shows, connections are frequently where the real-world number and the calculated one part ways.
Sources and further reading
Figures on this page are traceable to the published documents below. Where a standard is referenced, check the edition your local jurisdiction has adopted before relying on it.
- NEC Chapter 9, Table 8 — Conductor Properties (DC resistance, uncoated copper)NFPA 70, republished by buildmyowncabin.comResistance values referenced at 75 °C conductor temperature; source for the worked example below.
- NEC 210.19(A) Informational Note — branch circuit voltage dropNFPA 70, summarized by calcengineer.comThis note is advisory. It is not an enforceable requirement unless a local jurisdiction adopted it as one.
- ABYC E-11 conductor sizing tables for 3% and 10% voltage dropAmerican Boat and Yacht Council, reproduced with permission by BoatHowTo